Cloud Security Monitoring: Tools, Methods and Best Practices
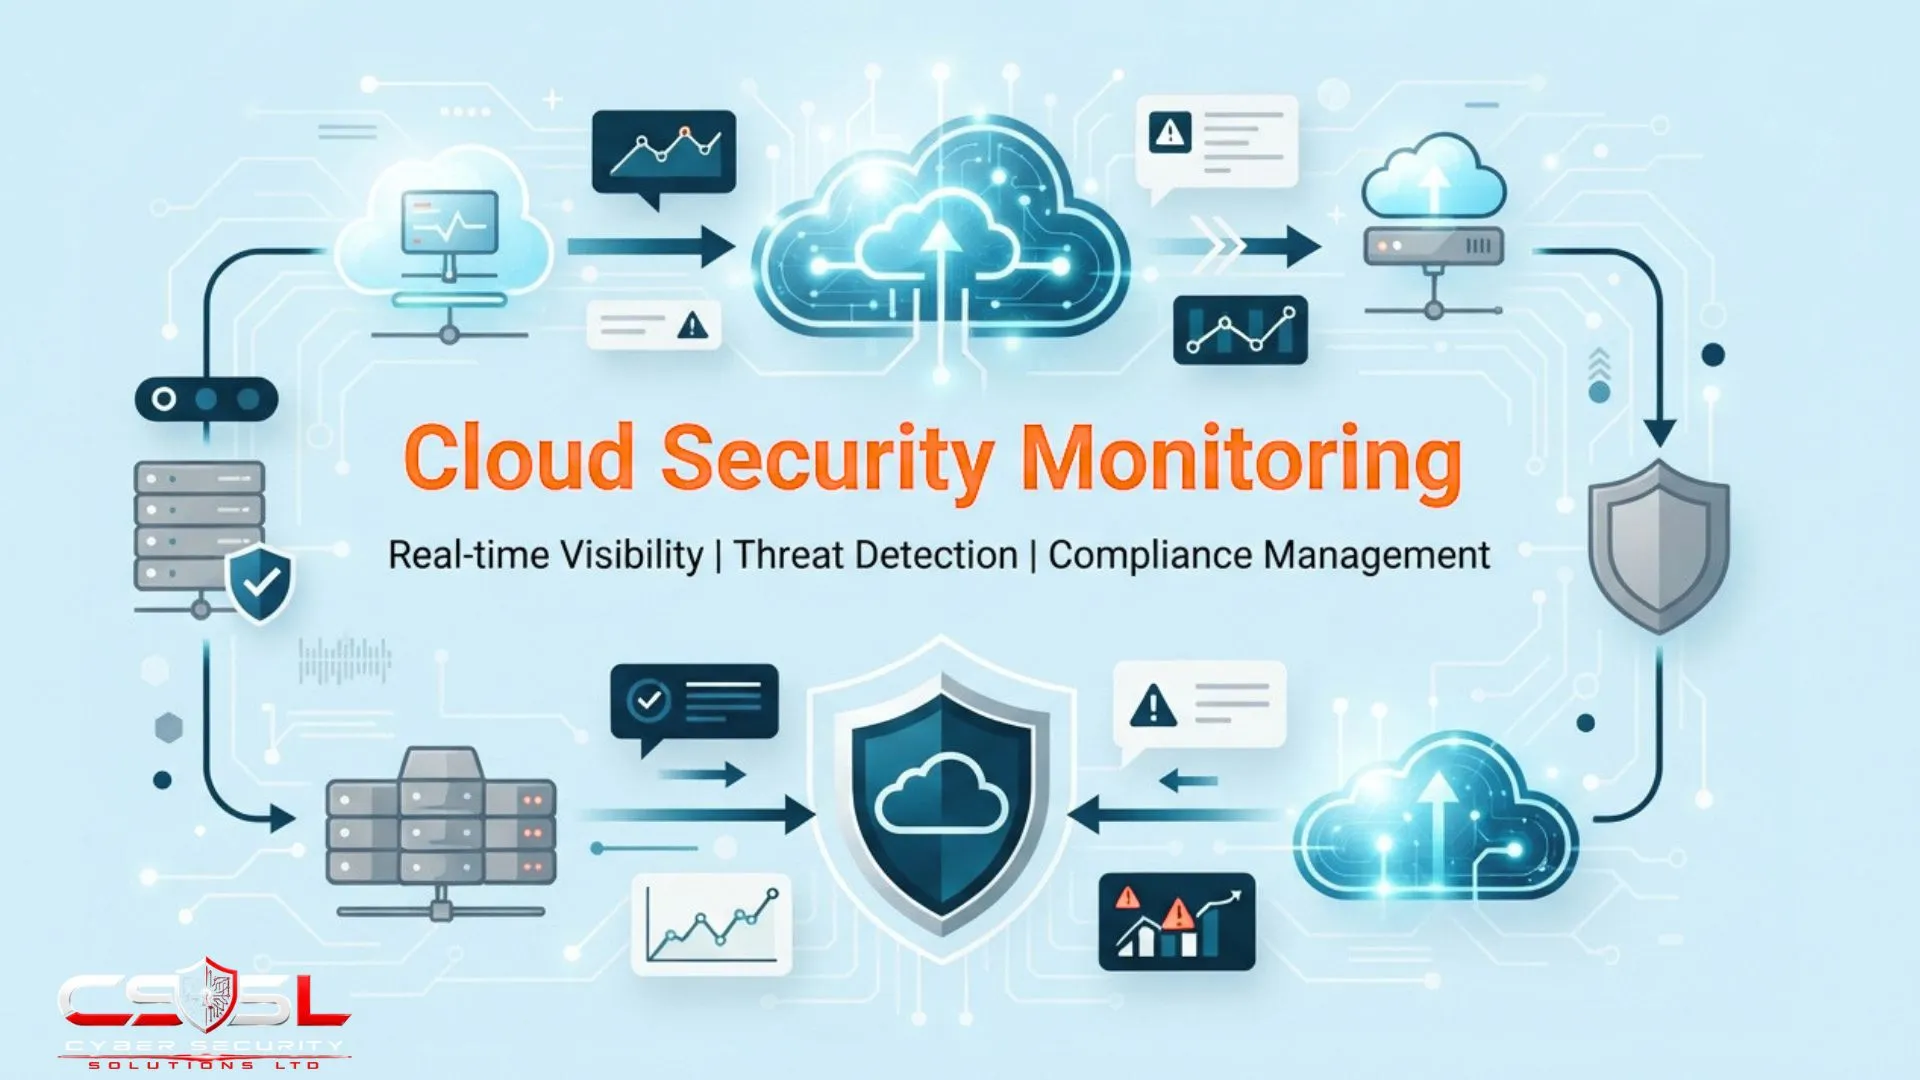
Cloud security monitoring is the continuous practice of collecting, correlating and acting on telemetry across your entire cloud environment, not just running automated scans. If you have monitoring tools running everywhere and still missed a genuine incident for days, this guide explains exactly why that keeps happening.
What Is Cloud Security Monitoring?
This is the continuous practice of collecting, correlating and analyzing telemetry across every layer of a cloud environment to detect anomalous or malicious activity in real time, spanning far more than any single tool’s configuration checks.
Coverage completeness, time to first scan, scan freshness and mean time to detect describe how well an agentless scanning tool sees configuration state, covered elsewhere in this series. This post covers how well an organization watches, correlates and acts on everything that tool and every other telemetry source produces together.
Shared responsibility makes this always a customer obligation. Audit logging and monitoring of an organization’s own use of a service sits on the customer side of the line at every service tier, IaaS through SaaS, with no exception, making monitoring one of the few responsibilities that never transfers regardless of how much infrastructure the provider manages.
What Telemetry Sources Feed a Genuine Cloud Security Monitoring Practice?
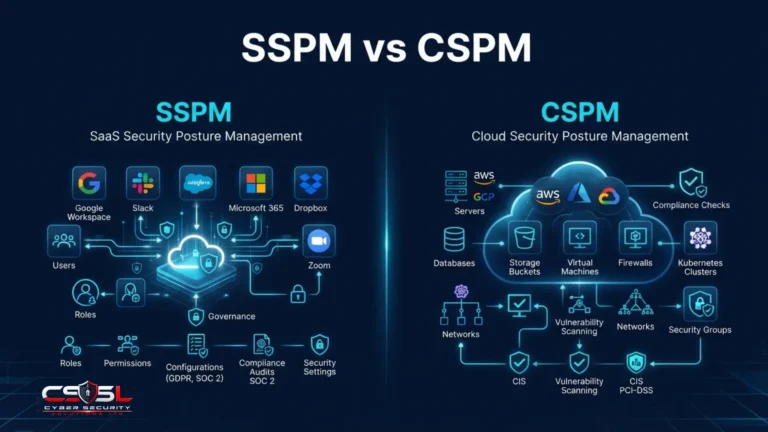
A genuine practice draws on posture and entitlement findings, CSPM, DSPM and CIEM continuous scan output, one input among several rather than the whole picture.
Cloud-native audit and API logs, AWS CloudTrail, Azure Monitor and Google Cloud Audit Logs, capture every API call, configuration change and administrative action. Network flow logs, VPC Flow Logs, NSG Flow Logs and Google Cloud VPC Flow Logs, reveal traffic patterns that indicate lateral movement or unintended communication paths.
Identity and authentication logs cover sign-in activity, conditional access decisions and MFA challenge outcomes. Application, container and CASB telemetry each add a distinct layer no other source replicates. Correlation across all these sources, not any single one, is the actual goal, the direct extension of attack path correlation principles already established elsewhere in this series, applied here to real-time telemetry rather than static findings.
Why Does Traditional SIEM Struggle With Cloud Environments?
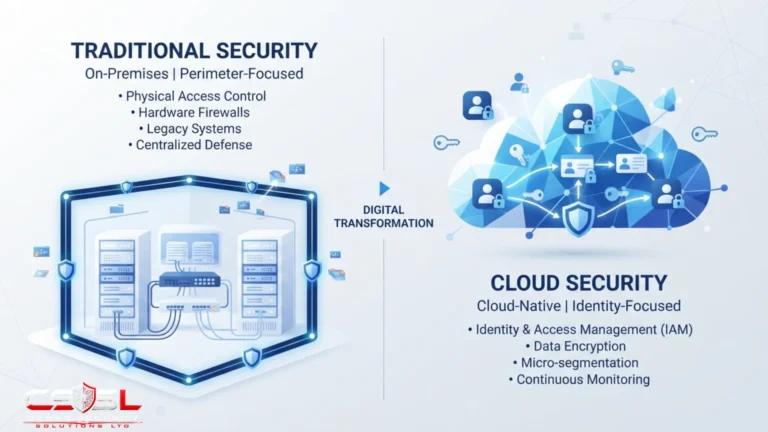
Traditional SIEM was architected around on-premise log formats and does not natively parse cloud-specific event structures without dedicated connector configuration. Cloud-native options like Microsoft Sentinel and Google Security Operations, plus cloud-extended Splunk, address this directly.
| Criteria | Traditional SIEM | Cloud-Native SIEM/XDR |
| Log format compatibility | Built for on-premise formats | Native cloud event parsing |
| Cross-domain correlation | Requires manual configuration | Built in from the start |
| Scaling cost model | Sized for on-premise volumes | Designed for cloud-scale data |
| Deployment speed | Slower, connector-dependent | Faster, cloud-native from day one |
Here is the mechanism worth stating plainly, since this gap gets named constantly in passing but rarely explained. Traditional SIEM platforms were built around firewall syslogs and Windows Event Logs, structured formats designed for on-premise infrastructure. Cloud environments generate an entirely different event structure, API calls, configuration changes, administrative actions, and a SIEM built for the old format cannot parse the new one without dedicated connectors.
Organizations migrating to cloud routinely discover their existing SIEM investment requires significant extension rather than working out of the box. That is not a minor inconvenience. It means a tool an organization already trusted quietly stops seeing a meaningful share of what is actually happening, until someone notices and builds the missing connectors.
Log volume itself is a genuine cloud-specific problem too. The sheer volume of API call and audit log data cloud environments generate at scale can overwhelm traditional SIEM licensing models built around on-premise log volumes, making cost as much a factor in platform selection as technical capability.
What Is XDR, and How Does It Extend Cloud Security Monitoring Further?
Extended Detection and Response correlates telemetry across multiple security domains simultaneously, endpoint, network, email, cloud, into a single detection and investigation layer, rather than requiring an analyst to manually pivot between separate consoles for each domain.
This matters specifically for cloud because an attack that begins with a phishing email, moves to a compromised endpoint, then pivots into cloud account access is far easier to investigate as one correlated timeline than as three separate, disconnected alert streams.
Full XDR mechanics and endpoint-specific detection sit more naturally within the Endpoint Security pillar. This section’s job is showing how cloud telemetry feeds into and benefits from that broader correlation layer, not explaining XDR exhaustively.
What Cloud Security Metrics Matter at the Operations Level?
Beyond mean time to detect, the metrics that actually matter are mean time to respond, the gap between an alert firing and meaningful human action, and signal-to-noise ratio, the proportion of alerts that are genuinely actionable versus noise.
| Metric | What It Measures | Why It Matters |
| MTTD (recap) | How fast a tool detects an issue | Tool-level scanning speed, covered elsewhere |
| MTTR | Time from alert to meaningful human action | Reveals the real response gap MTTD hides |
| Signal-to-noise ratio | Genuine findings vs. false positives | Shows if the programme actually functions |
| Alert volume per analyst | Findings per team member | Reveals realistic review capacity |
| Dwell time | How long a compromise sits undetected | Shows true exposure window |
Coverage completeness, time to first scan, scan freshness and mean time to detect were established elsewhere in this series as tool-level scanning metrics. This section introduces genuinely new territory that post never addressed.
Mean time to respond is the time between an alert firing and a human analyst taking meaningful action on it, a distinct and often larger gap than mean time to detect alone suggests. A tool can fire an alert in seconds. Nothing meaningful happens until someone actually reads it and acts.
Signal-to-noise ratio, the proportion of alerts that represent genuine, actionable findings versus false positives or low-value noise, is the single metric most directly tied to whether a monitoring programme is actually functioning or merely generating unreviewed volume.
Alert volume per analyst and dwell time round out the picture, capacity metrics revealing whether a team can realistically review what its tooling produces, and how long a genuine compromise sits undetected once it has occurred. Reporting only mean time to detect to leadership tells an incomplete story. An organization can have excellent detection speed at the tool level while still taking days to respond, if the operational layer reviewing those detections is under-resourced.
What Causes Alert Fatigue in Cloud Security Monitoring, and How Do You Fix It?
Alert fatigue happens when monitoring across every telemetry source produces more alerts than any realistically staffed team can review, burying genuine findings in volume. Adding tooling without a corresponding correlation layer makes this worse, not better.
Deploying full monitoring across every telemetry source covered above routinely produces alert volumes that exceed what a realistically staffed team can review individually. When that happens, genuine, high-priority alerts get lost in undifferentiated volume, exactly the same pattern already established elsewhere in this brand’s content for attachment scanning and DLP tuning.
Here is the counterintuitive part most content misses. More tooling makes this worse, not better, without corresponding investment in triage capability. Each new telemetry source added without a correlation and prioritization layer increases raw alert volume linearly while providing no proportional increase in genuine signal. Buying another tool does not fix an already overwhelmed team. It adds to the pile.
Practical remediation starts with tuning detection rules against actual false positive rates rather than leaving default sensitivity unchanged indefinitely. Use CNAPP-style correlation to surface compound, high-confidence findings ahead of isolated, lower-context ones. Build tiered triage structures, a first-line team filtering volume before escalating genuinely significant findings to senior analysts, rather than expecting every alert equal attention.
Exactly as CSPM, DSPM and CIEM findings require a committed remediation process to convert into actual risk reduction, monitoring output requires a committed triage and response process to convert into actual detection value. Alert fatigue, not missing tooling, is the single most common gap Cyber Security Solutions Ltd finds during a monitoring maturity review.
What Cloud Security Monitoring Tools Are Available in 2026?
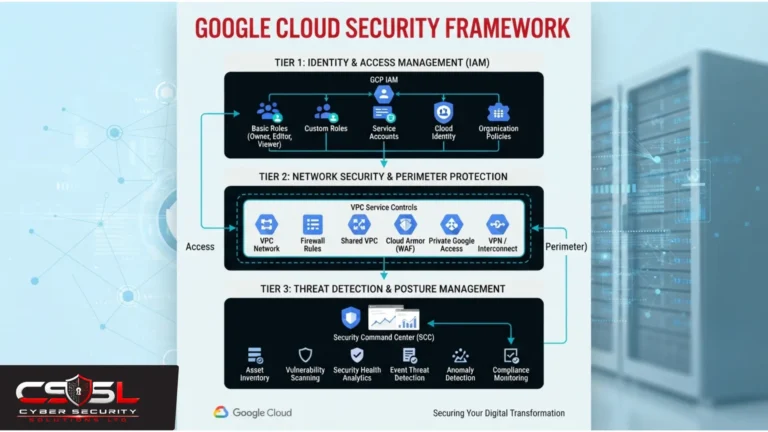
Native provider tools include AWS Security Hub and GuardDuty, Microsoft Defender for Cloud and Sentinel, and Google Security Command Center, each providing baseline, single-provider-scoped monitoring.
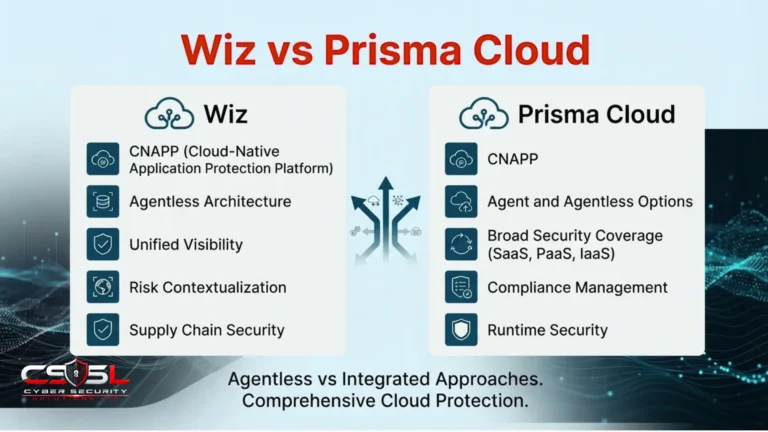
CNAPP-integrated monitoring, Wiz, Prisma Cloud, Orca Security and Lacework, already covered in depth elsewhere in this series, increasingly bundles real-time detection alongside posture and entitlement scanning.
Dedicated SIEM and XDR platforms, Splunk, Datadog and CrowdStrike, offer cloud-capable log aggregation, correlation and cross-domain detection at varying depth and cost. Full comparative treatment is deferred to the dedicated tools guide; this section stays illustrative rather than exhaustive.
Should You Build Your Own Cloud Security Operations Function, or Use a Monitoring Service?
The same build, buy or managed decision logic established for cloud security capability generally applies with particular force to monitoring, since 24/7 coverage is one of the hardest capabilities for a lean internal team to sustain.
CloudSecOps describes the specific people, process and on-call structure required to actually run a monitoring function day to day, a direct parallel to DevSecOps, not just the tooling behind it.
Managed detection and response outsources continuous monitoring and initial triage to a specialist provider, particularly relevant where staffing depth cannot sustain genuine 24/7 coverage. This decision should reflect actual staffing reality, not aspiration. A monitoring programme staffed for business-hours-only coverage while claiming 24/7 protection creates a false sense of security more dangerous than acknowledging the gap and planning around it.
How Do You Implement Cloud Security Monitoring Step by Step?
Implementing monitoring starts with inventorying existing telemetry, selecting a cloud-native SIEM or XDR platform, configuring cross-source correlation rules, establishing baseline metrics, tuning detection rules against real false positive data, building tiered triage, deciding in-house versus managed coverage, and reviewing metrics and staffing capacity on an ongoing basis.
- Inventory every telemetry source already available across your environment before adding any new tooling.
- Select a SIEM or XDR platform capable of natively parsing cloud-specific log formats, rather than assuming an existing SIEM extends automatically.
- Configure correlation rules that combine findings across sources, using attack path correlation logic as the model.
- Establish baseline metrics, including MTTD, MTTR and signal-to-noise ratio, before tuning anything further.
- Tune detection rules against real false positive data on a regular cadence.
- Build a tiered triage structure appropriate to your team size.
- Decide whether monitoring is staffed in-house, supplemented by a managed service, or fully outsourced, domain by domain if needed.
- Review metrics and staffing capacity regularly, since alert volume and telemetry sources both grow continuously.
Conclusion
Cloud security monitoring only works if someone is actually watching what it surfaces. Tools alone will not save you from an alert queue nobody has time to review. Track response speed alongside detection speed, tune your rules against real false positives, and be honest about whether your coverage is genuinely 24/7 or just labelled that way.
FAQs
Posture scanning measures how well a tool sees configuration state, coverage, scan freshness, detection speed. Monitoring is the broader, continuous practice of collecting, correlating and acting on telemetry across every layer, including the human triage capacity needed to actually convert alerts into detection value.
Traditional SIEM was architected around on-premise log formats like firewall syslogs and Windows Event Logs. It does not natively parse cloud-specific event structures without dedicated connector configuration, which is why many organizations discover their existing investment needs significant extension after migrating to cloud.
MTTD measures how fast a tool detects an issue. MTTR measures the time between an alert firing and a human analyst taking meaningful action on it, often a distinct and larger gap. Reporting MTTD alone can make response speed look better than it actually is.
This is alert fatigue. Full monitoring across every telemetry source produces volumes exceeding what a realistically staffed team can review, and genuine findings get lost in the noise. Adding more tooling without a corresponding correlation layer makes this worse, not better.
It depends on staffing reality, not aspiration. Genuine 24/7 coverage is one of the hardest capabilities for a lean internal team to sustain. Managed detection and response can supplement or replace in-house coverage where staffing depth falls short of round-the-clock claims.
XDR correlates telemetry across multiple domains, endpoint, network, email, cloud, into one detection layer instead of separate consoles. It is most valuable when an attack could plausibly span those domains, letting an analyst investigate one correlated timeline rather than pivoting between disconnected tools.