Cloud Security ROI: How to Measure and Justify the Investment
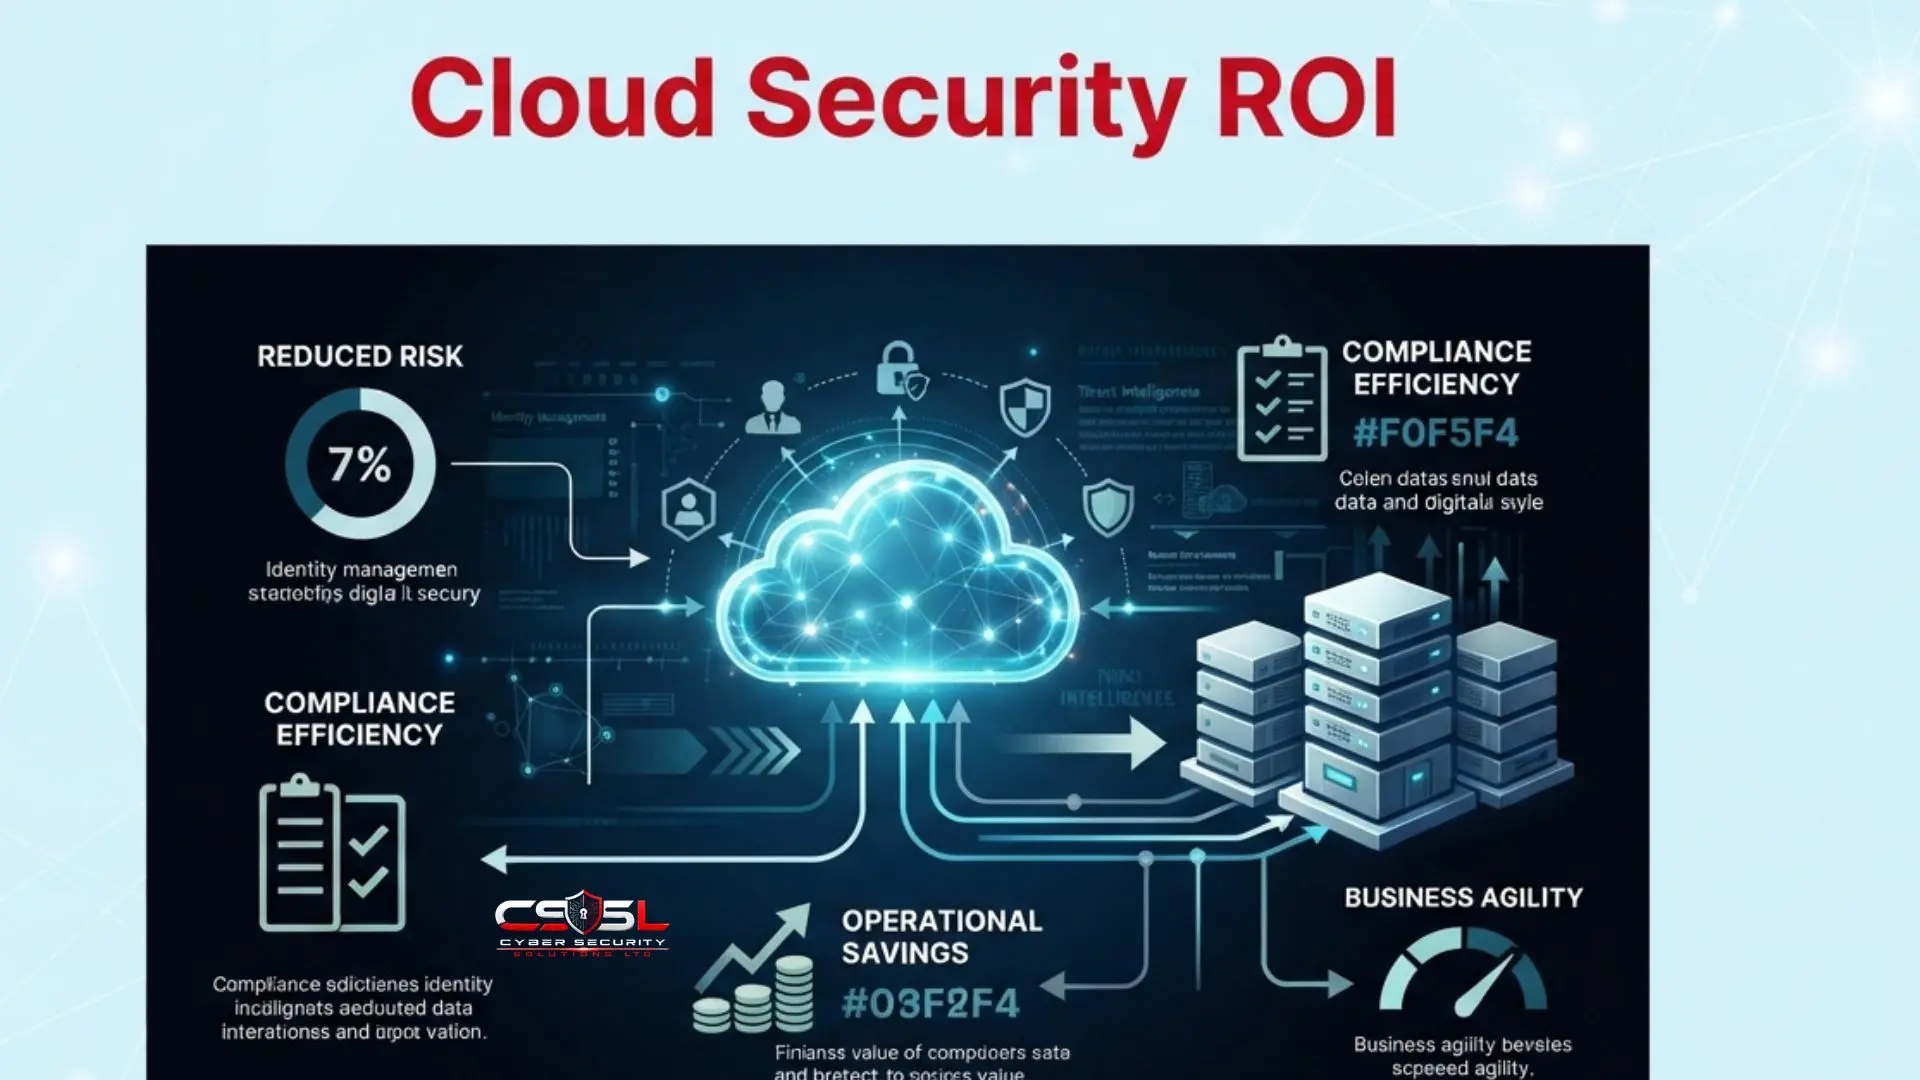
Cloud security ROI should be measured as portfolio-level, probability-weighted cost avoidance rather than a single tool’s isolated return, combining quantified risk reduction from methods like FAIR with direct cost-reduction levers such as automation and platform consolidation.
If you requested budget for five separate cloud security tools and finance rejected each one as too small to prioritize on its own, or your CFO wants a clear ROI figure and you do not know how to calculate one honestly for something that prevents losses rather than makes money, this guide gives you the exact methodology to fix both problems.
Why Is Cloud Security ROI Harder to Calculate Than a Single Tool’s ROI?
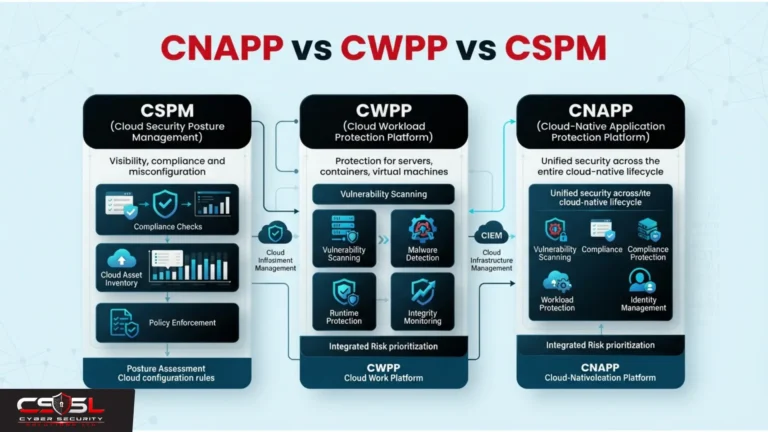
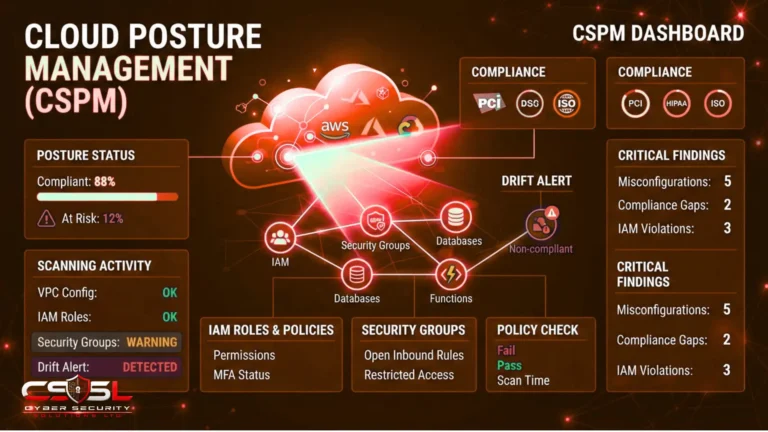
Unlike a single security purchase decision, cloud security spans CSPM, DSPM, CIEM, CNAPP, monitoring, and automation simultaneously, meaning a genuine ROI case must justify a connected portfolio rather than one isolated line item competing independently for budget.
The portfolio problem is this post’s central argument, and it is the specific reason cloud security ROI genuinely differs from calculating ROI for a single security tool, the pattern most competitor content follows. Security spending generally proves its value by preventing losses rather than generating revenue, an already awkward fit for traditional ROI formulas. Layering a multi-tool portfolio on top of that existing difficulty means finance teams frequently see several separate budget requests with no visible connection between them, weakening each individual case regardless of how well justified any single tool might be in isolation.
Consider the realistic pattern this produces: an organization requests budget for CSPM, then separately for DSPM, then separately for CIEM, then separately for monitoring automation, each pitched as its own standalone business case with its own standalone ROI justification. A CFO evaluating five separate, individually modest requests, each addressing what looks like a narrow, specific problem, has no visibility into how these requests relate to each other or to the organization’s actual overall risk exposure. Each request competes for attention against every other budget line item in the organization, including growth initiatives with much clearer revenue upside, and modest individual asks are precisely the requests most likely to be deprioritized or rejected in this competitive environment.
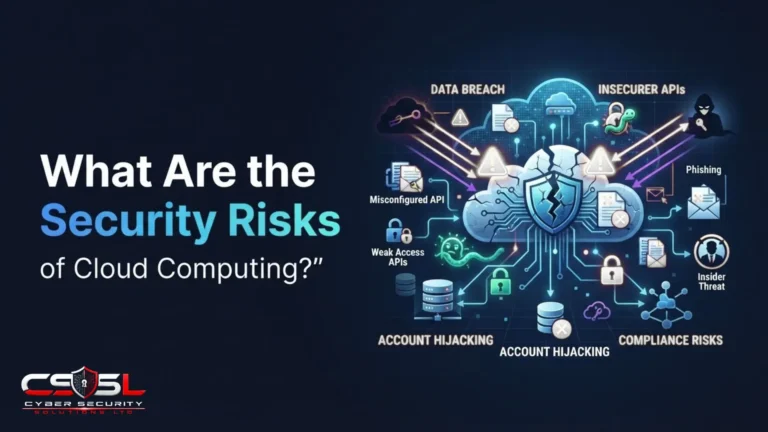
The honest framing this post commits to is treating cloud security ROI as portfolio-level, probability-weighted risk reduction and cost avoidance, presented as one coordinated case rather than a collection of disconnected tool purchases each fighting for justification independently. See Why Is Cloud Security Important? Risks, Costs and Business Impact for the foundational risk case this methodology builds on.
What Is the Real Cost of a Cloud Security Breach, and How Do You Use That Figure Honestly?
The real cost of a cloud security breach includes direct costs, incident response, regulatory fines, legal costs, notification expenses, and indirect costs, customer churn, reputational damage, and insurance premium increases, alongside operational disruption costs specific to cloud-dependent operations.
Use Gartner’s misconfiguration-prevalence data alongside IBM’s Cost of a Data Breach figures to build a defensible, organization-specific expected-loss estimate rather than quoting an industry average as if it applied uniformly to every organization. A generic figure quoted without adjustment for your own cloud footprint, sector, and risk profile is easy for a sceptical finance team to dismiss as marketing rather than analysis.
Honesty about estimate uncertainty builds rather than undermines credibility with a financially sophisticated audience. A range presented with a stated confidence basis is more persuasive than a single, falsely precise figure, since a CFO evaluating a suspiciously precise number instinctively questions how it was derived, while a stated range grounded in documented methodology survives that scrutiny far better.
How Does Cloud Security Actually Reduce Cost, Not Just Reduce Risk?
| Lever | Related Focus Area | Type of Saving |
| Automation | Remediation labour | Direct cost reduction |
| CNAPP consolidation | Tool sprawl and licensing | Direct cost reduction |
| Faster detection (MTTD/MTTR) | Detection and response speed | Risk avoidance |
| Refactored migration approach | Long-term architecture | Risk avoidance |
| Portfolio-level tooling | Combined coverage | Both |
Cloud security automation reduces the labor cost of manual remediation at scale and directly improves Mean Time to Respond, a metric already correlating with lower breach cost according to IBM’s own research. CNAPP consolidation reduces vendor sprawl, licensing overlap, and the management overhead of running multiple disconnected point tools, a genuine, calculable cost reduction distinct from risk reduction. Faster detection converts MTTD and MTTR improvements from a purely operational metric into a monetary argument, since detection speed directly correlates with lower total breach cost.
Cloud security cost reduction here is distinct from FinOps-style cloud bill optimization. This methodology addresses the cost of incidents, tooling overlap, and remediation labour specifically, not the separate discipline of reducing general cloud infrastructure spend.
How Do You Turn a Risk Assessment into a Quantified Business Case?
Take the highest-priority risks from your existing risk register, apply FAIR’s loss magnitude and loss event frequency estimation to your highest-value findings specifically, and use the resulting monetary range as the expected-loss figure your proposed investment is measured against.
A business case built without a prior risk assessment behind it is an unsupported spending request. A business case built on top of one is evidence-based cost avoidance with a documented methodology behind every figure, giving finance stakeholders something they can interrogate and trust rather than simply accept on faith.
How Do You Calculate ROI Across a Portfolio of Cloud Security Tools, Not One Line Item?
| Methodology | What It Measures | Best Used For |
| Qualitative risk scoring | Relative severity ranking | Early prioritization, low resource |
| FAIR (quantitative risk) | Monetary loss magnitude and frequency | Individual risk quantification |
| Forrester TEI (portfolio investment) | Combined cost, benefit and flexibility value | Multi-tool portfolio business cases |
Rather than calculating ROI separately for CSPM, then separately for CIEM, then separately for monitoring, map each tool’s contribution against the specific risk categories it addresses from your risk register, then present the combined portfolio’s aggregate risk reduction against its combined cost. This avoids the common failure mode where individually justified tools lose to individually larger competing budget requests.
Introducing Forrester Total Economic Impact as a named, credible methodology specifically built for this kind of multi-component technology investment case is the genuinely differentiating contribution most competitor content never makes, since almost no cloud security ROI content names a specific framework suited to portfolio-level cases at all. FAIR is purpose-built for quantifying individual risk scenarios into monetary loss estimates, answering how much a specific risk is worth addressing. TEI is purpose-built for a different, complementary question: evaluating the combined value of a technology investment spanning multiple components, benefits, costs, and flexibility value, exactly the structure a cloud security portfolio actually has.
Using FAIR alone to justify a portfolio risks presenting five separate risk-quantification exercises stitched together loosely, which retains much of the disconnected-request weakness this section is designed to solve. Using TEI as the overarching portfolio framework, with FAIR-derived risk quantification feeding into it as the risk-avoidance component of TEI’s broader cost and benefit calculation, produces a genuinely unified business case: one document, one methodology, one aggregate number, supported by the more granular FAIR analysis behind each contributing risk category. This two-layer approach is precisely the methodological sophistication that distinguishes a genuinely defensible portfolio business case from a stapled-together collection of separate tool justifications presented under one cover page. Citing both named methodologies explicitly also gives the business case more credibility with a financially literate board, since referencing recognized, externally validated frameworks demonstrates the analysis followed established practice rather than an internally invented calculation.
How Does Your Migration Approach and Maturity Stage Change the ROI Calculation?
A rehosted, unpatched legacy workload carries forward ongoing remediation cost indefinitely, while a refactored, cloud-native rebuild costs more upfront but carries materially lower long-term risk and remediation cost, meaning the migration approach itself is a long-term cost decision this ROI methodology should explicitly account for.
The migration approach an organization chose, or is currently choosing, deserves treatment as its own quantifiable cost decision, not as a separate, unrelated architectural conversation happening in a different budget meeting. A rehosted legacy workload, lifted and shifted to cloud infrastructure with minimal modification, typically carries forward the same underlying vulnerabilities and configuration weaknesses it had on-premise, meaning ongoing remediation cost continues indefinitely rather than being resolved by the migration itself. A refactored, cloud-native rebuild costs more upfront, often significantly more, but is specifically designed to eliminate many of these ongoing weaknesses at the architecture level, reducing the long-term remediation cost stream that a rehosted equivalent would continue generating for years.
This means a full ROI comparison between migration approaches should weight not just the upfront migration cost difference, but the multi-year remediation cost stream each approach generates afterward. An organization choosing the cheaper rehost option purely on upfront cost, without accounting for the ongoing remediation cost it locks in for years afterward, may be making a decision that looks financially sound in year one and becomes progressively more expensive relative to the refactored alternative by year three or four.
The diminishing-returns framing across maturity stages provides equally useful budget-setting context. The jump from Initial or Ad Hoc maturity to Developing maturity typically involves closing the most obvious, highest-volume gaps, missing MFA enforcement, completely unmonitored configurations, and this initial investment buys down the highest-likelihood risk first, delivering the steepest cost-avoidance return per dollar spent. Each subsequent maturity stage addresses progressively narrower, lower-likelihood residual risk, meaning the same dollar of investment delivers progressively smaller marginal risk reduction as maturity increases. This is not a reason to stop investing in higher maturity stages, since residual risk at any stage remains genuine risk, but it is essential, honest context for setting realistic executive expectations about where the steepest early returns come from.
Build, Buy or Strategy Services — How Do You Calculate Which Option Actually Pays Off?
Compare the fully loaded cost of building and retaining in-house specialist capability, salary, training, and the cloud security skills-gap premium, against the cost of managed services or outside strategy services, weighted against the risk-reduction speed each option realistically delivers.
Speed to competence deserves treatment as a genuine financial variable in this comparison, not a soft operational consideration mentioned in passing, because most competitor build-versus-buy content compares only steady-state ongoing cost once capability is fully established, systematically ignoring the cost of the build-out period itself.
Consider the realistic timeline: an organization deciding to build in-house CIEM expertise, for example, must recruit specialists in an area the (ISC)² Cybersecurity Workforce Study consistently documents as facing significant talent scarcity, then allow time for those specialists to become genuinely familiar with the organization’s specific environment, then build and refine detection and remediation processes from scratch. This build-out period commonly extends across many months. During this entire period, the organization’s actual entitlement risk exposure remains largely unaddressed, since the in-house capability being built has not yet reached genuine operational maturity.
A managed service or experienced outside strategy partner, by contrast, typically delivers meaningful risk-reduction capability from the first weeks of engagement, since the provider already has trained specialists, established processes, and cross-client pattern recognition the in-house build has not yet developed. Comparing only the steady-state annual cost of each option misses this entire build-out period difference, and specifically misses that the cheaper build option is silently carrying a materially higher cost of unmitigated risk during the months it takes to reach equivalent capability. A genuinely complete financial comparison must incorporate this time-weighted risk exposure difference, not just the eventual steady-state cost once both options have theoretically reached full operational maturity, since for many organizations the build option never actually closes this gap given ongoing staff turnover in a specialized, high-demand talent market.
What Cloud Security Metrics Should You Actually Report to a Board or CFO?
The metrics that belong in a board or CFO report are financial ones: cost-avoidance ratio comparing expected loss avoided against investment cost, cost per finding remediated, and portfolio-level risk reduction trend over time.
Explicit three-way disambiguation of “cloud security metrics” is essential here, because this term legitimately means two genuinely different things elsewhere in cloud security discussion, and this post’s meaning is a third, distinct category entirely that requires its own clear naming to avoid confusion.
Tool-level scanning metrics, mean time to detect, scan freshness, and rule coverage, are the metrics a technical team monitoring CSPM and CIEM tooling tracks day to day, measuring whether the scanning technology itself is functioning correctly. Operations-level response metrics, mean time to respond and signal-to-noise ratio, measure how effectively a security operations function is acting on what the tooling surfaces. Both categories are genuinely important, and both belong in technical team dashboards.
Neither category, however, belongs in a board or CFO presentation in raw technical form, because neither answers the specific question a financially oriented audience needs answered: what is this investment actually worth in terms this audience can evaluate against every other competing use of the same budget. The third category, financial and business metrics specifically, exists to bridge this gap. Cost-avoidance ratio expresses the relationship between estimated loss avoided and money spent in a single comparable figure a CFO can weigh against any other investment decision. Cost per finding remediated demonstrates operational efficiency in financial terms. Portfolio-level risk reduction trend shows the aggregate direction of the entire security investment over time. Reporting the correct metric category to the correct audience is not dumbing down the technical detail; it is translating genuine technical progress into the specific currency the receiving audience actually uses to evaluate value.
How Do You Present Cloud Security ROI Without Overstating Certainty?
Lead with the specific, prioritized risks from your risk register rather than generic industry statistics, since concrete, organization-specific figures build more credibility than borrowed averages. Present a clear range rather than a single misleadingly precise number, and state the methodology, FAIR, TEI, or qualitative, the range is derived from. Acknowledge explicitly that security investment reduces probability and impact rather than guaranteeing prevention, since overstating certainty damages credibility with a financially sophisticated audience more than honest uncertainty does.
Cyber Security Solutions Ltd builds quantified risk and cost-avoidance assessments using this exact FAIR and TEI-informed methodology, tailored to each organization’s specific risk register and tool portfolio.
How Do You Build a Cloud Security ROI Case Step by Step?
Step 1: Use your existing risk register to identify the specific, highest-priority risks the proposed investment addresses.
Step 2: Apply FAIR or a comparable quantitative method to convert those risks into an estimated monetary loss range.
Step 3: Map each proposed tool or service in your portfolio against the specific risk categories it addresses, rather than justifying each in isolation.
Step 4: Calculate direct cost-reduction levers separately from risk-avoidance value, including automation-driven labor savings and CNAPP-driven consolidation savings.
Step 5: Compare build, buy, and managed-service or strategy-service options using fully loaded cost and realistic time-to-competence.
Step 6: Translate technical metrics into financial language before presenting to non-technical stakeholders.
Step 7: Present a defensible range with stated methodology rather than a single, falsely precise figure.
Step 8: Track actual outcomes against the projected case over time, updating the business case as real data accumulates rather than treating it as a one-time pitch.
Conclusion
Cloud security ROI genuinely differs from a single tool’s ROI because the investment itself is a portfolio, not a line item, and treating it that way with FAIR-quantified risk feeding into a TEI-style aggregate case produces a materially stronger business case than five separate requests ever will. Visit cybersecuritysolutionsltd.com for a quantified risk and cost-avoidance assessment that builds a defensible, board-ready business case for your specific cloud security investment decisions.
FAQs
Calculate it as portfolio-level, probability-weighted cost avoidance rather than a single isolated tool return. Use FAIR to quantify individual risks into monetary loss ranges, map your tool portfolio against those risk categories, add direct cost-reduction levers like automation, and present the combined figure with stated methodology.
Cloud security spans CSPM, DSPM, CIEM, CNAPP, monitoring, and automation simultaneously. Individually justified budget requests for each tool compete separately against other priorities and frequently lose, while the same tools presented as one coordinated portfolio addressing a documented risk set make a materially stronger case.
FAIR, Factor Analysis of Information Risk, converts identified risks into estimated monetary loss ranges using loss magnitude and loss event frequency. It transforms a qualitative risk register into quantified figures a financially sophisticated audience can evaluate directly against proposed investment cost.
Forrester Total Economic Impact evaluates the combined value of a multi-component technology investment, covering costs, benefits, and flexibility value together. It is purpose-built for portfolio-level cases, unlike FAIR, which quantifies individual risks, making TEI the appropriate overarching framework for justifying a cloud security tool stack.
It depends on speed to competence, not just steady-state cost. Building in-house often takes many months to reach genuine operational maturity given talent scarcity, during which risk remains largely unaddressed. A managed service typically delivers meaningful risk reduction from the first weeks of engagement.
Report financial metrics specifically: cost-avoidance ratio, cost per finding remediated, and portfolio-level risk reduction trend. Technical metrics like MTTD belong in technical dashboards, not board reports, unless translated into their estimated financial impact on expected breach cost.