Network Security Monitoring: Tools, Methods and Best Practices
Network security monitoring is the continuous practice of collecting and analyzing telemetry from firewalls, IDS/IPS, DNS, and flow data across a network, typically centralized through a SIEM, to establish real-time visibility. It’s distinct from the detection techniques and formal response process that follow once monitoring surfaces a genuine concern.
What Is Network Security Monitoring, and How Is It Different from Detection and Response?
Network security monitoring is the continuous practice of collecting, aggregating, and reviewing telemetry from across a network to establish visibility into what’s actually happening on it, in real time or close to it.
It’s worth being precise about scope here, because these three related disciplines get blurred together constantly. This guide covers the infrastructure and practice of collecting and watching that telemetry. Recognizing an actual attack within that data, through threat hunting and pattern methodology, is its own specific discipline. Responding once a genuine incident is confirmed, through a structured, formal process, is a third, separate discipline entirely. Treating all three as one blurred activity is exactly how gaps form between them.
One quick, direct recap worth keeping in mind: IDS/IPS alerts are one of several telemetry sources feeding into this broader monitoring practice, not a standalone, isolated tool operating on its own.
Why Does Monitoring Speed Matter This Much Right Now?
Here’s a genuinely striking number worth sitting with. CrowdStrike’s 2026 Global Threat Report found the average interval between initial compromise and lateral movement, what the industry calls breakout time, fell to just 29 minutes in 2025, a 65% acceleration from the year before. The fastest recorded breakout took just 27 seconds. In one documented case, data exfiltration began within four minutes of initial access.
Mandiant’s M-Trends 2026 report adds a second, complementary angle. Global median attacker dwell time, how long an intruder actually stays undetected once inside, rose to 14 days in 2025, up from 11 the year before. Organizations detected malicious activity internally only 52% of the time, meaning nearly half of all breaches only came to light because someone outside the organization reported them.
There’s one more honest, current detail worth noting without overstating it. Mandiant’s same report estimates that mean time to exploit has gone negative for some vulnerabilities, meaning exploitation is now routinely occurring before a patch is even publicly available. That’s a meaningful shift. It reinforces why continuous monitoring, not patch-cycle timing alone, has become the genuine control determining business impact when something does go wrong.
What Telemetry Sources Feed Network Security Monitoring?
Network security monitoring draws on several distinct data sources, each revealing a different piece of the picture.
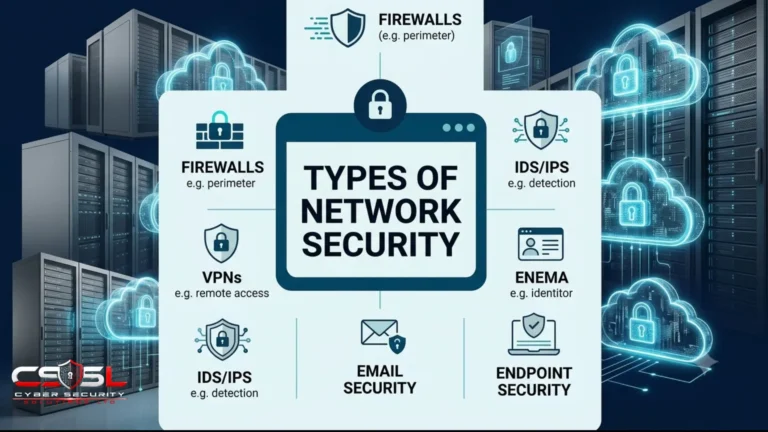
- Firewall and gateway logs: recording every allow and deny decision made at your network’s boundary, the foundational filtering layer this entire pillar has built on.
- IDS/IPS alerts: signature and anomaly-based findings feeding directly into the broader monitoring picture.
- Authentication and access logs: recording every login attempt, successful or failed, across your network infrastructure.
- DNS query logs: a frequently underused but genuinely valuable source, given how often DNS gets abused for both initial compromise and data exfiltration.
- Network flow data: metadata about traffic patterns without full content inspection, covered properly in the next section.
Network Security Monitoring Telemetry Sources
| Source | What It Captures |
| Firewall/gateway logs | Every allow and deny decision at the boundary |
| IDS/IPS alerts | Signature and anomaly-based findings |
| Authentication logs | Every login attempt, successful or failed |
| DNS query logs | Domain lookups, often abused for compromise and exfiltration |
| NetFlow/flow data | Traffic metadata: source, destination, volume, duration |
NetFlow vs Deep Packet Inspection — Two Fundamentally Different Ways of Seeing Your Network
Here’s a distinction most competitor content treats as one undifferentiated blob called “network visibility.” It genuinely isn’t, and understanding the difference changes how you actually build monitoring at scale.
Deep packet inspection is deep but narrow. It reads actual packet content, at real computational cost, and it does not scale cheaply across an entire network’s full traffic volume. Running full content inspection on every single byte crossing your network, all the time, isn’t realistic for most organizations. It’s a powerful, precise tool, but a genuinely expensive one to run everywhere at once.
NetFlow, and its related standards sFlow and IPFIX, work completely differently. Instead of reading content, NetFlow records metadata about each traffic flow: source, destination, volume, duration, and protocol, without ever reading what’s actually inside that traffic. That makes it dramatically lighter-weight, able to provide broad, continuous visibility across an entire network at a scale full content inspection simply can’t sustain.
Here’s why both matter together, rather than one replacing the other. NetFlow-style data is what makes it practical to notice an unusual pattern continuously, across your entire network, at 3am, without anyone watching. Picture a single device suddenly transferring an enormous volume of data to an unfamiliar external destination in the middle of the night. NetFlow can flag that pattern instantly, cheaply, and at scale, because it’s only looking at metadata, not content. That flagged pattern is exactly what then earns a closer look. Deep packet inspection steps in at that point, providing the deep, content-level confirmation of what that suspicious traffic actually contains, once NetFlow has already narrowed attention to something specific worth the computational cost of examining closely.
This is the practical reason organizations don’t have to choose between broad, cheap visibility and deep, expensive inspection. NetFlow does the broad scanning work continuously and affordably. DPI does the precise confirmation work exactly where it’s needed. Running DPI everywhere is unnecessary and expensive; running only NetFlow everywhere means you’d notice a pattern but never actually confirm what it contains. Together, they cover a gap neither one closes alone.
NetFlow vs Deep Packet Inspection
| Criteria | NetFlow/Flow Data | Deep Packet Inspection |
| What it captures | Traffic metadata only | Actual packet payload content |
| Resource cost | Low, lightweight | High, computationally intensive |
| Scale achievable | Broad, entire network continuously | Narrow, targeted traffic |
| Typical use case | Spotting unusual patterns network-wide | Confirming what a specific pattern actually contains |
What Is a SIEM, and Why Does It Sit at the Centre of Modern Monitoring?
A Security Information and Event Management platform, or SIEM, aggregates and normalizes log and event data from many different sources across your network into a single, centralized system, then correlates that data to surface patterns no single source alone would ever reveal.
The genuine value here is in correlation, and it’s worth understanding concretely. A single failed login means almost nothing on its own; people mistype passwords constantly. But that same failed login, correlated with an unusual DNS query, a new outbound connection, and a sudden spike in data transfer, all from the same device within the same short window, tells a materially different and far more urgent story. No single log source would ever surface that pattern in isolation. Only correlation across sources reveals it.
Log normalization is a necessary but often underappreciated function behind that correlation. It’s the process of translating log data from dozens of different vendor formats into one consistent, comparable structure. Without it, meaningfully correlating data across sources simply isn’t practically possible, since you’d be comparing incompatible formats that were never designed to talk to each other.
A Security Operations Centre, or SOC, is the human function operating this platform: the team responsible for triaging, investigating, and escalating what the SIEM surfaces, whether that team is staffed in-house or provided through a managed service. Cyber Security Solutions Ltd frequently helps businesses set up correlation rules that surface this kind of genuine, compound signal rather than flooding a SOC with isolated, low-value noise.
The Alert Fatigue Problem — Why More Tools Can Mean Worse Visibility
Here’s an honest problem most vendor pitches conveniently skip. Deploying comprehensive monitoring across every telemetry source above routinely produces alert volumes that exceed what any realistically staffed team can review individually. More coverage doesn’t automatically mean better protection.
Research indicates security analysts investigate fewer than half of the security alerts they receive in a given workday. That’s a striking, uncomfortable number worth sitting with. It means genuine indicators of compromise are frequently sitting in an uninvestigated queue, not because the technology failed to catch them, but because there simply weren’t enough human hours to look at everything the technology flagged.
Here’s the counterintuitive part most businesses discover the hard way: adding more tooling makes this worse, not better, unless it comes with a corresponding investment in tuning and triage. Each additional telemetry source added without a matching correlation and prioritization layer increases raw alert volume without a proportional increase in genuine signal. A business that adds a new monitoring tool every year, without ever revisiting how those combined alerts get triaged, ends up with more noise burying the same amount of real signal, and an analyst team that’s increasingly desensitized to alerts in general.
The practical fix isn’t fewer tools; it’s smarter processing of what those tools produce. Tuning detection rules against real, observed false-positive data reduces the noise those specific rules generate over time. Using SIEM correlation to surface compound, higher-confidence findings ahead of isolated single-source alerts means your team’s limited attention goes to the alerts most likely to matter. And where appropriate, layering automation to handle well-understood, repetitive triage work reduces the manual burden sitting on your human analysts, freeing their attention for the genuinely ambiguous cases that actually need a person’s judgment.
What Metrics Matter, and Why Sources Disagree on the Numbers?
Mean Time to Detect and dwell time are the two most commonly cited metrics in this space, and it’s worth defining them precisely before using either one. Dwell time is the total period an attacker remains undetected inside a network. MTTD is the organizational metric describing the average time between compromise and awareness.
Here’s the honest explanation for why cited figures vary so widely across different reports, and it’s genuinely not because someone is wrong. Mandiant’s own dwell-time statistics, that 14-day median for 2025, are drawn specifically from incidents sophisticated enough to require specialist incident response investigation. That’s a real, but narrower, sample skewed toward more advanced intrusions. IBM’s Cost of a Data Breach figures, averaging 158 days, the lowest in nine years, come from a broader base of reported breaches using a different methodology entirely, capturing a wider mix of incident types. SANS’s own real-time SOC benchmarks measure something genuinely different again: the top 25% of organizations detecting within 60 minutes, more than half within five hours. That’s how quickly a live alert gets triaged once it fires, not how long a stealthy, undiscovered intrusion sat present before anyone noticed.
None of these three numbers is wrong. They’re measuring genuinely different things, drawn from genuinely different samples, using genuinely different methodology. The practical takeaway is to stop fixating on a single, universally “correct” benchmark figure. Track your own organization’s MTTD trend over time instead, and benchmark it honestly against whichever source’s methodology sits closest to your own actual monitoring maturity and incident volume.
In-House Monitoring vs Managed Network Security Monitoring Services
Here’s an honest decision worth framing clearly rather than resolving with a one-size-fits-all answer. Building and staffing genuine 24/7 monitoring capability in-house requires sustained resourcing that few organizations outside the largest enterprises can realistically maintain around the clock, night shifts, weekend coverage, and all.
Managed network security monitoring services offer an alternative worth introducing here, though full vendor evaluation deserves its own dedicated, deeper treatment. This means outsourcing continuous monitoring and initial triage to a specialist provider, particularly relevant for organizations lacking the staffing depth for genuine round-the-clock coverage themselves.
Here’s why acknowledging a genuine coverage gap honestly beats pretending it doesn’t exist. An organization staffed only for business-hours monitoring, while quietly assuming they have full-time protection, creates a false sense of security that’s more dangerous than openly planning around the actual gap. Given that breakout times now measure in minutes, not hours, a business-hours-only monitoring posture facing an overnight attack has already lost meaningful ground before anyone even arrives to look at the alert queue the next morning.
How Do You Build a Network Security Monitoring Capability Step by Step?
- Inventory every telemetry source already available across your environment before adding any new tooling on top of what you already have.
- Deploy or consolidate onto a SIEM capable of aggregating and correlating findings across every source, rather than reviewing each one in isolation.
- Layer NetFlow-style broad visibility alongside the deeper, narrower inspection DPI and IDS/IPS already provide.
- Establish baseline MTTD tracking for your own organization before benchmarking against any external figure.
- Tune detection rules against real false-positive data on a regular, scheduled cadence.
- Build a tiered triage structure appropriate to your team size, so alert volume gets filtered before it reaches your most experienced analysts.
- Decide honestly, based on actual staffing capacity, whether monitoring is genuinely covered in-house, supplemented by a managed service, or fully outsourced.
Conclusion
Monitoring only earns its value if someone’s actually watching what it surfaces, and if the signal isn’t buried under noise nobody has time to review. Build broad visibility with NetFlow, confirm with DPI where it matters, and be honest with yourself about whether your current staffing can genuinely cover the clock. If you want a clear read on where your own setup stands, Cyber Security Solutions Ltd can walk through it with you.
FAQs
A SIEM (Security Information and Event Management) platform aggregates and normalizes log data from many sources across a network into one centralized system, then correlates it to surface patterns no single source alone would reveal.
NetFlow records lightweight traffic metadata, source, destination, volume, without reading content, enabling broad network-wide visibility. Deep packet inspection reads actual packet content, deep but narrow and resource-intensive. They work best together, not as substitutes.
Comprehensive monitoring produces alert volumes exceeding what any realistically staffed team can review. Research indicates analysts investigate fewer than half of daily alerts, meaning genuine indicators often sit uninvestigated rather than being missed technically.
Mean Time to Detect (MTTD) is the average time between compromise and awareness. It differs from dwell time, the total period an attacker remains undetected, and figures vary widely depending on the source’s methodology.
Mandiant’s dwell-time figures come from incidents sophisticated enough to need specialist investigation, IBM’s figures come from a broader breach base with different methodology, and SANS measures live alert-to-triage speed, a genuinely different, faster metric than dwell time.
It depends on your staffing capacity. Genuine 24/7 in-house monitoring requires sustained resourcing few organizations outside large enterprises maintain. A managed service is often more realistic for organizations lacking round-the-clock staffing depth.