Cyber Security KPI Examples: How to Measure Your Security Programme
Cyber security KPI examples only matter if they answer one question honestly: is your risk going up or down. Most dashboards track activity instead, alert counts, patch numbers, training completions, without ever answering that question. Here’s what to measure instead, and why boards keep missing the point of the numbers they’re given.
What is risk posture, and how do you measure it?
Risk posture is the balance between your organization’s cyber exposure and how much risk it’s willing to tolerate, measured at a point in time. It’s different from security posture, which measures the raw strength of your controls, since strong controls can still leave you exposed if your risk appetite was never actually defined.
Most businesses measure security posture, patch rates, MFA coverage, EDR deployment, and assume that’s the same as understanding risk posture. It isn’t. Risk posture requires three inputs together: your actual exposure data, your control maturity, and a documented risk appetite stating what level of loss the business considers acceptable. Without that third piece, a security posture score of 90% tells you nothing about whether the remaining 10% sits in your most critical system or your least. A useful risk posture measurement always names both the exposure and the tolerance it’s being measured against, not just a single composite score.
Metric vs KPI: the distinction that changes how you report
A metric is a raw data point describing what’s happening. A KPI is a rate-based measurement tied to a specific business objective, describing how well you’re performing against it. Reporting metrics to a board when they expect KPIs is the single most common cause of glazed-over eyes in a security presentation.
| Type | Answers | Example | Audience |
| Metric | What is happening? | Number of unpatched critical vulnerabilities | Analysts, operational teams |
| KPI | How well are we performing? | Patch latency (average days to apply a patch) | CISO, executives, board |
| KRI | What could go wrong? | Vulnerability exposure time on a critical asset | Risk management, CISO |
A raw alert count is a metric. Mean time to resolve is a KPI, because it’s rate-based and tied to a business outcome, response efficiency. Vulnerability exposure time before a fix is a key risk indicator, because it flags danger before it becomes an incident. Sorting your existing dashboard into these three buckets, before adding a single new number, usually reveals you’re reporting mostly metrics to an audience that needs KPIs.
The core KPIs every programme should track
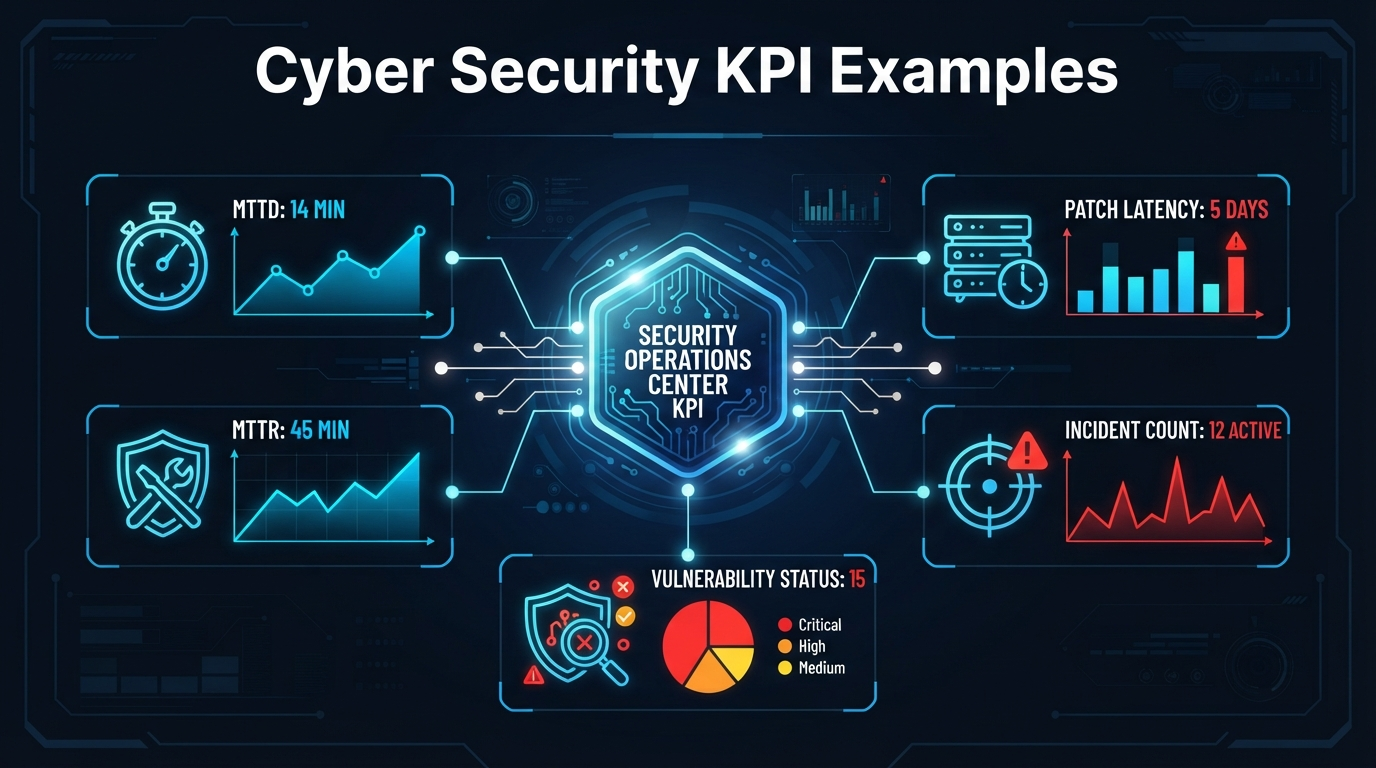
Every security programme needs four operational KPIs at minimum: mean time to detect (MTTD), mean time to respond (MTTR), mean time to contain (MTTC), and patch latency. These four together describe how fast you notice, react to, and close down a threat.
| KPI | Measures | Why It Matters |
| MTTD | Time from incident occurrence to detection | Shorter MTTD limits attacker dwell time |
| MTTR | Time from detection to full remediation | Measures overall response efficiency |
| MTTC | Time from detection to containment | Faster containment limits blast radius |
| Patch Latency | Days between patch release and application | Directly shrinks your exploitation window |
These four give you the timeline of an incident from start to finish, and each measures a distinct phase, so improving one doesn’t automatically improve the others. A team can have excellent MTTD and still have poor MTTC if containment is manual and slow, which is exactly the kind of gap these four KPIs, tracked together, are designed to expose.
Coverage metrics: what good looks like
Coverage metrics measure what percentage of your critical assets are actually protected by a given control, not whether the control exists somewhere in your environment. The gap between “we have EDR” and “EDR covers 100% of critical endpoints” is where most real exposure lives.
Treat coverage as a percentage, never a checkbox. A business with EDR deployed on 70% of endpoints doesn’t have EDR coverage, it has a 30% gap that attackers will find. The same logic applies to MFA: recent breach research found only 23% of organizations with third-party access fully remediated missing or improperly configured MFA on cloud accounts, meaning the remaining 77% carried an unmeasured coverage gap that standard “do we have MFA” reporting would have missed entirely. Track coverage percentage for your top three controls, EDR, MFA, and patch compliance, against your full critical asset inventory, not just the systems that were easy to check.
Vendor and supply chain KPIs you probably aren’t tracking yet
Third-party involvement now appears in 48% of all breaches, up 60% year over year according to the Verizon 2026 Data Breach Investigations Report, making vendor risk one of the fastest-growing categories most security programmes still measure the least.
Two vendor KPIs matter most: average vendor security rating, an external, objective score reflecting your third-party ecosystem’s cyber health, and mean time for vendor incident response, how quickly a partner acknowledges and begins containing an issue you’ve flagged in their environment. Most SMBs have no idea which vendors hold access to their systems, let alone how those vendors are performing against either metric. A business owner recognizes this scenario immediately: your payroll provider, your IT support contractor, and your accounting software vendor all have some level of access to your data, and if any one of them is breached, you inherit the consequences even though the failure wasn’t yours. Start tracking, at minimum, which vendors hold privileged access and whether they’ve provided a current security certification like SOC 2 or ISO 27001, since that single check closes the most common gap in vendor risk tracking today.
Why executives so often don’t understand the metrics they’re given
The problem usually isn’t communication skill, it’s that most boards never formally defined a risk appetite to measure against. Recent research found 55% of boards have never formally defined what level of cyber risk the company is willing to accept, and only 12.5% of security leaders are very confident their board understands the true state of the programme after a presentation.
This changes where the fix belongs. CISOs are told for years to “communicate better,” but you cannot report status against a baseline that was never set. The same research found 71% of security leaders spend 10 or more hours preparing each board report, often producing detailed, well-designed dashboards that still land flat, because the board has no agreed reference point for whether a given number is good or bad. Separately, 42% of security leaders reported having to defend a third-party security score in the past year, meaning even external, seemingly objective metrics get challenged without a shared framework for interpreting them. The fix starts before the next report gets built: get the board to formally agree a risk appetite statement first, in writing, and every metric afterward becomes a comparison against that agreed line rather than an isolated number open to interpretation. Skipping this step is why so many well-built dashboards still fail to land.
Turning gaps into dollars: Cyber Risk Quantification explained
Cyber Risk Quantification, or CRQ, translates security findings into dollar figures instead of high-medium-low ratings, using models like FAIR to multiply the likely frequency of a loss event by its likely financial magnitude. This gives executives a number they can directly compare against the cost of fixing it.
FAIR, or Factor Analysis of Information Risk, was developed by Jack Jones in 2005 and is now recognized as a standard by The Open Group. The core calculation is straightforward in concept: estimate how often a specific risk scenario is likely to occur in a year, estimate the financial magnitude if it does, and multiply them to produce an annualized loss expectancy. In practice this produces genuinely useful prioritization: one commonly cited worked example shows a SQL injection vulnerability carrying roughly $2 million in annual risk exposure against roughly $50,000 for a comparable cross-site scripting flaw, once frequency and likely loss are both factored in. That gap gives your engineering team a defensible, dollar-based priority list instead of two findings both labeled “high” on a heat map. You don’t need full CRQ maturity to start, even a rough FAIR-style estimate on your three riskiest findings gives you a stronger budget conversation than a severity color ever will.
Where does this fit against NCSC CAF and Cyber Essentials benchmarks?
The NCSC Cyber Assessment Framework rates 39 contributing outcomes across 4 objectives and 14 principles, each scored Achieved, Partially Achieved, or Not Achieved against published Indicators of Good Practice. It’s the formal benchmark for UK operators of essential services, while Cyber Essentials serves as the lighter baseline most UK SMBs actually pursue.
CAF isn’t a pass-fail checklist, it’s a rubric: each contributing outcome gets judged against specific evidence, a policy version, a scan output, a board minute reference, not a vague self-assessment. UK businesses outside CAF’s mandatory scope can still borrow its structure usefully, since rating your own controls as Achieved, Partially Achieved, or Not Achieved against a defined standard produces a far more credible internal KPI set than an informal percentage score invented in-house. If your business already holds Cyber Essentials, treat CAF’s three-tier rating language as the natural next step in maturity, not a separate, unrelated framework to learn from scratch.
A realistic starting KPI set if you’re not running an enterprise programme
Track five KPIs to start: MTTD, MTTR, patch latency, MFA coverage percentage, and a documented risk appetite statement agreed with leadership. This covers detection speed, response speed, patching discipline, one critical coverage metric, and the reference point every other number needs to mean anything.
Resist the urge to build a 20-metric dashboard before any of these five are reliably tracked. A business that can honestly report its patch latency and MFA coverage percentage, alongside a leadership-agreed risk appetite, is already ahead of most SMBs still reporting raw alert counts. Cyber Security Solutions Ltd builds exactly this five-KPI starting set with clients who don’t have a dedicated security function, and it consistently produces a stronger, more defensible board conversation than a wider dashboard nobody fully trusts. Expand from there only once these five are genuinely reliable, not before.
Conclusion
Good cyber security KPI examples come down to five honest numbers, detection speed, response speed, patch discipline, coverage percentage, and an agreed risk appetite to measure everything else against. Skip the twenty-metric dashboard until those five are solid, and translate your worst gaps into dollars before your next budget conversation. If you want help building a KPI set your board will actually trust, Cyber Security Solutions Ltd can walk through it with you at cybersecuritysolutionsltd.com.
FAQs
Cybersecurity KPIs are rate-based measurements tied to specific security objectives, showing how well a programme is performing rather than just what’s happening. Examples include mean time to detect, mean time to respond, and patch latency. Unlike raw metrics, KPIs are designed for executive and board-level reporting.
A metric is a raw data point, like the number of unpatched vulnerabilities. A KPI is a rate-based measurement tied to a business objective, like patch latency, the average time to apply a patch. Metrics answer “what’s happening,” while KPIs answer “how well are we performing.”
Risk posture is the balance between an organization’s cyber exposure and its defined risk tolerance at a point in time. It differs from security posture, which measures control strength alone. Measuring risk posture requires exposure data, control maturity, and an agreed risk appetite statement together.
The core set includes mean time to detect, mean time to respond, mean time to contain, and patch latency, covering detection through remediation. Coverage metrics for MFA and EDR, plus vendor security ratings, round out a realistic starting KPI set for most organizations.
Get the board to formally agree a risk appetite statement first. Without that reference point, even well-designed metrics land flat, since 55% of boards have never defined acceptable risk levels. Report every metric afterward as a comparison against that agreed line, not as an isolated number.
A cybersecurity maturity assessment evaluates the capability and consistency of your security processes over time, distinct from a point-in-time posture assessment. It typically uses a defined framework, like NCSC CAF’s three-tier rating system, to score how mature specific security functions are.
Use Cyber Risk Quantification, commonly the FAIR model, to estimate a risk’s annual dollar exposure by multiplying its likely frequency by its likely financial impact. Compare that annualized loss expectancy against the cost of the control that would reduce it to calculate a defensible ROI figure.